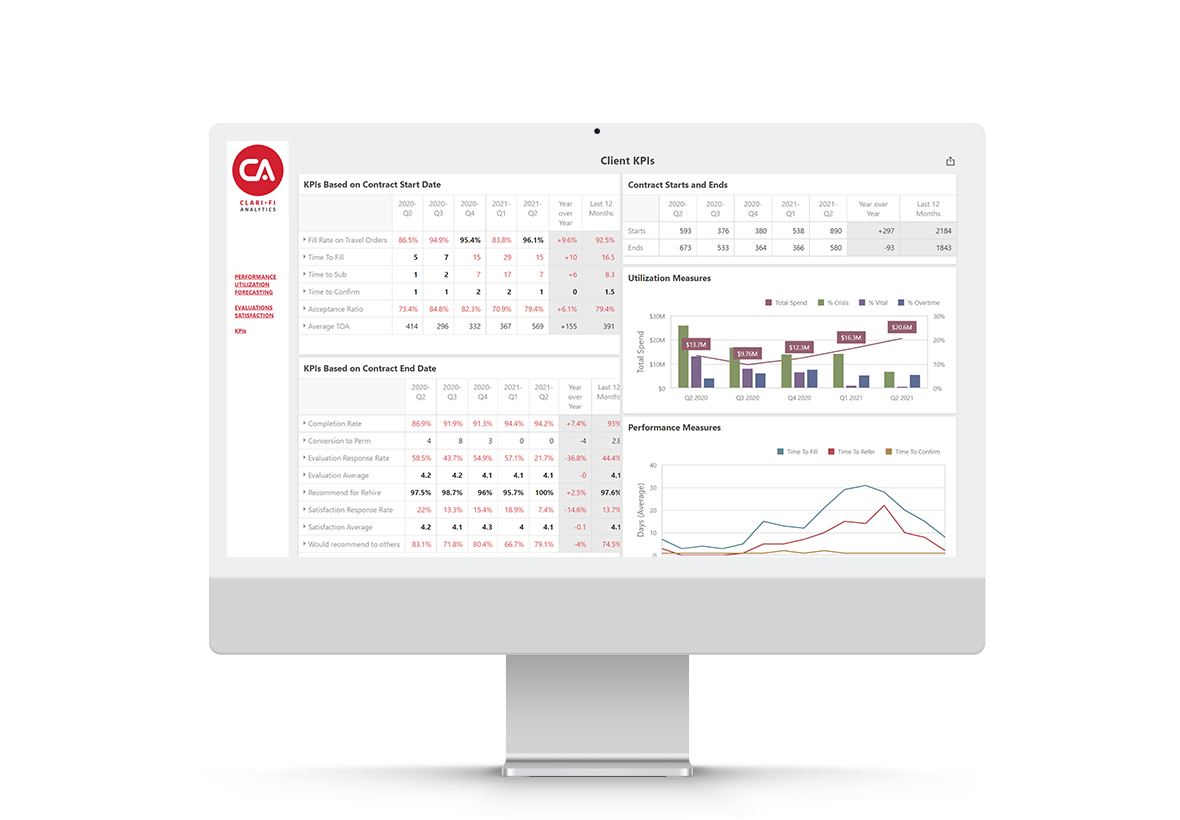
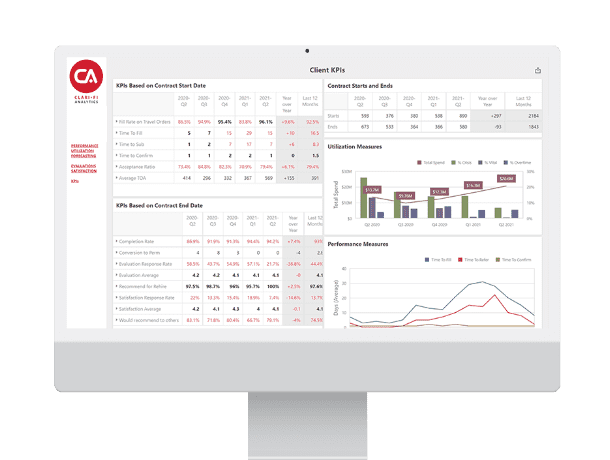
24/7 Access to Your Most Critical KPI’s
Real-time, transparent performance metrics at your fingertips including contract labor spend, fill and time measures, candidate submission, conversion, retention, and cancel rates.
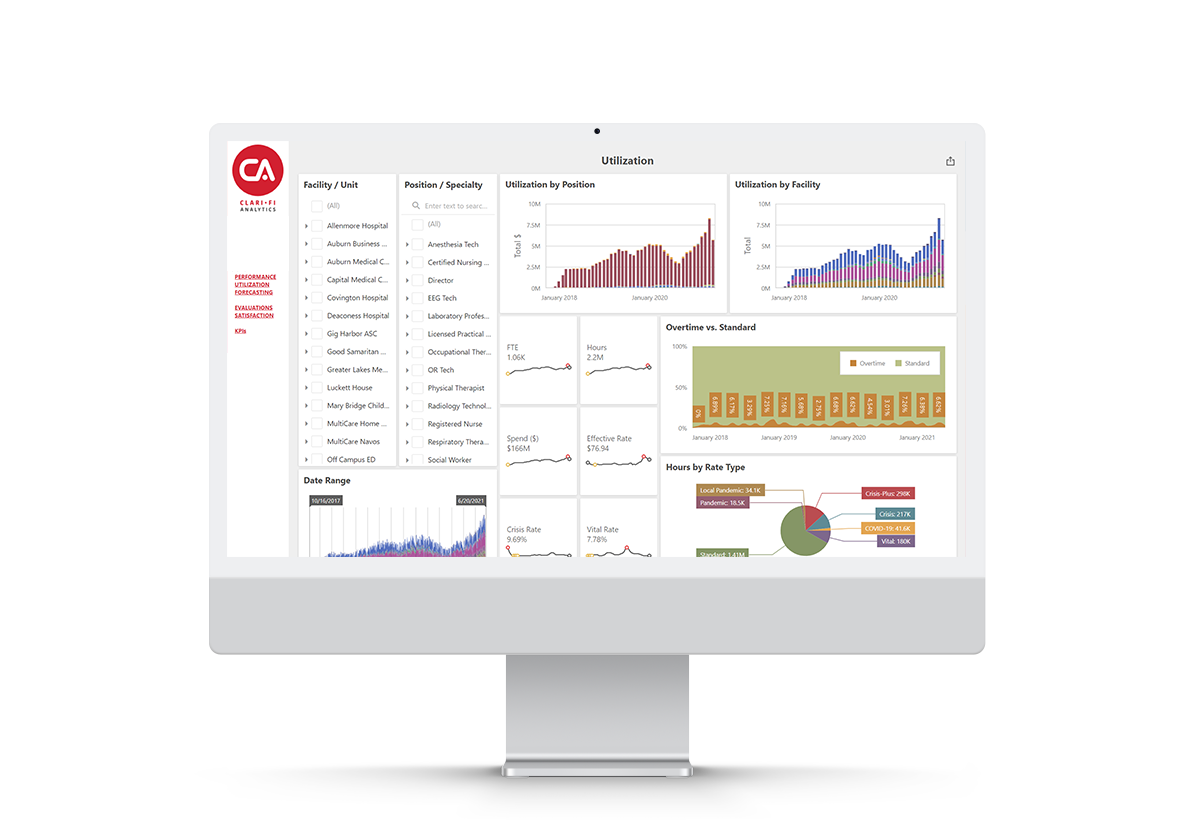
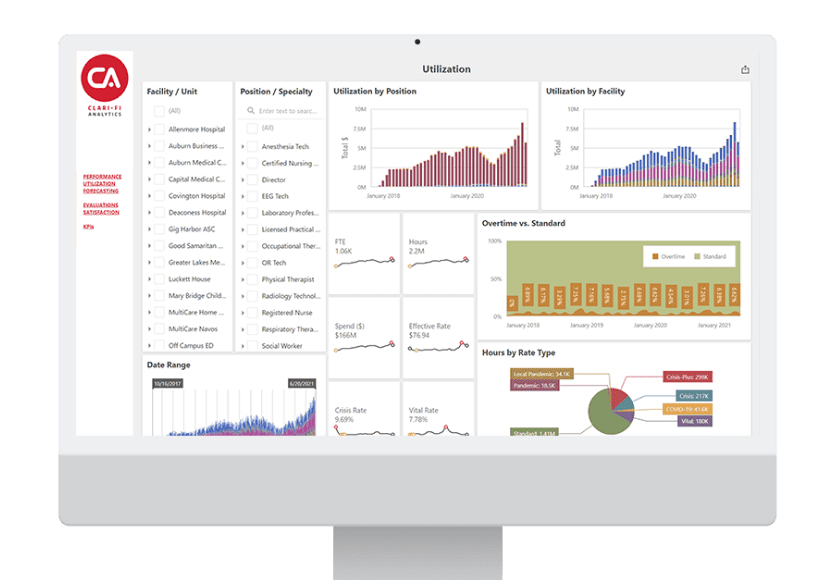
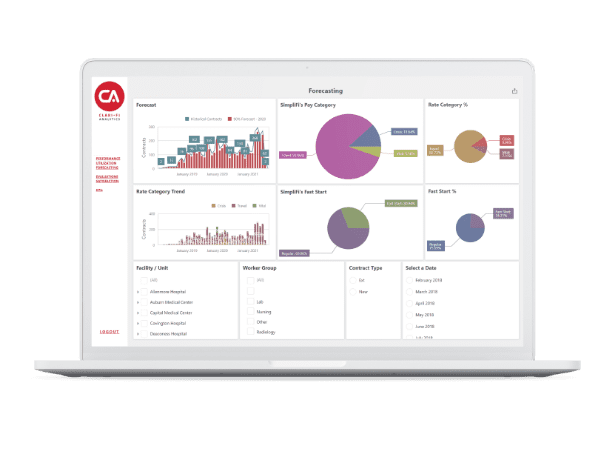
Analyze Your Data Real-Time
Robust reporting of utilization mix and trends, identification of spend and hours by unit, and use of premium rates.
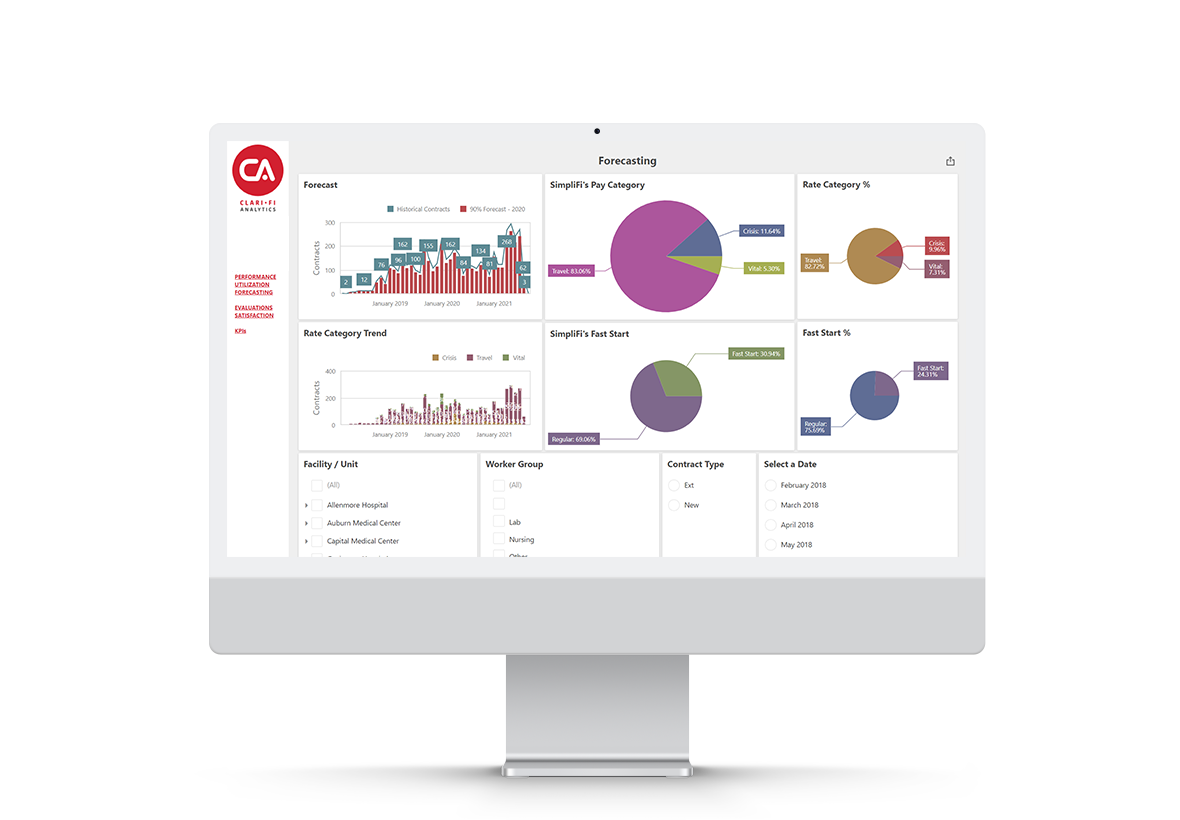
Learn how SimpliFi can leverage the power of ClariFi Analytics technology to deliver accurate reporting, insights, and predictions that drive successful outcomes
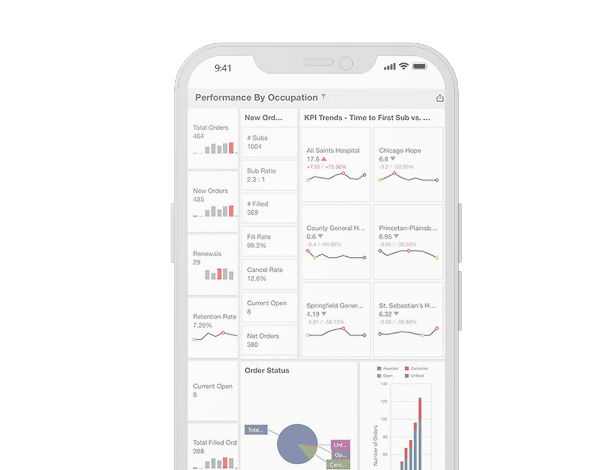
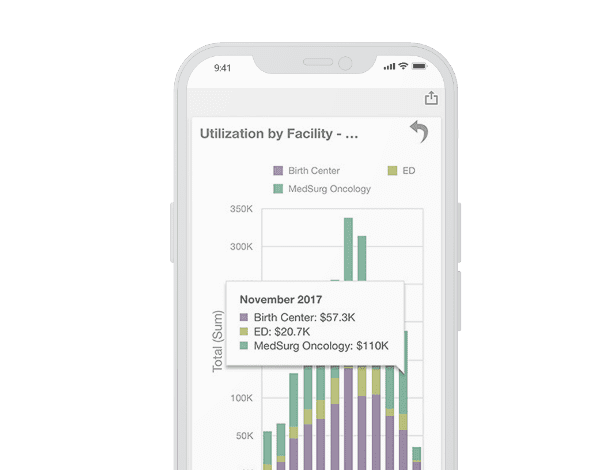
Customize Your Dashboards
Responsive dashboards allow for easy access to performance metrics on any device – anytime, anywhere.
Reporting When and Where You Need It
Never wait for another contingent labor report. Whether answering questions in the board room or creating next year’s budget, your most important data is right where you need it, when you need it.

Easy to Export and Share
Tailored reports are easily exported into Excel, made into a PDF or an image with one click.